

Dry Weekly Market Monitor - Week 08, 2025
Snapshot of Spot Freight Rates, Supply-Demand Trends, Port Congestions
February 19, 2025
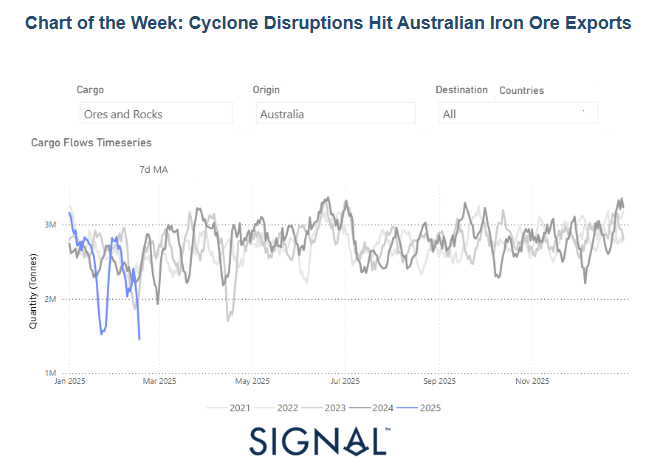
The sharp decline in Australian dry bulk flows in early 2025, as depicted in the data, can be directly linked to the severe disruptions caused by Cyclones Sean and Zelia. These extreme weather events led to temporary port closures, infrastructure damage, and halted mining operations, particularly in the ore-rich Pilbara region. The significant drop in cargo shipments in January 2025 aligns with historical patterns where natural disasters cause short-term supply chain disruptions. However, past trends suggest that export levels tend to recover once logistical operations resume, as seen in previous years' fluctuations. Given that Western Australia’s Port Hedland, the world’s largest iron ore hub, has reopened, the dip in bulk flows will likely be temporary, with shipments stabilizing in the coming months. This aligns with expectations that demand from key importers, such as China, will drive a rebound as supply normalizes.
From a market perspective, the immediate impact of these disruptions has been reflected in iron ore prices on global exchanges. The most-traded May iron ore contract on China’s Dalian Commodity Exchange experienced a dip, hitting its lowest since January 16, signaling cautious sentiment among traders. Similarly, the benchmark March contract on the Singapore Exchange dropped to its lowest point since early February. The market’s reaction underscores concerns over short-term supply constraints from Australia, which is a key supplier to China. However, as port operations recover and shipments resume, prices are expected to stabilize, potentially rebounding as steel demand in China picks up. The cyclical nature of the dry bulk market suggests that while adverse weather events create temporary shocks, the broader fundamentals—such as industrial demand and infrastructure investment—will ultimately dictate the trajectory of iron ore flows and pricing in the months ahead.

The overall trend for Capesize Brazil to North China rates remains bearish, while signs of a gradual recovery are emerging in the smaller vessel size segments.
Capesize vessel freight rates for shipments from Brazil to North China continue to show a bearish trend, with rates below the $17/tonne mark.
Panamax vessel freight rates from the Continent to the Far East declined to $29 per ton, representing a 27% drop year-over-year.
Supramax vessel freight rates on the Indo-ECI route have been revised above $8 per ton, reflecting a 9% increase compared to the previous month.
Handysize freight rates for the NOPAC Far East route have risen to $28 per ton, reflecting a 13% increase from the previous week.

The latest signs from the ballasters view continue to record an increased pace in the Capesize, Panamax, and Supramax vessel size segments.
Capesize SE Africa: The number of vessels held the pace of the previous week at 150, almost 40 above the annual average, holding a continued upward trend from the end of January.
Panamax SE Africa: The vessel count has remained steady over a month, reaching slightly above 180—45 above the annual average.
Supramax SE Asia: The third week of February held the spike, with figures still rising to 110—nearly 10 above the annual trend.
Handysize NOPAC: The Handy NOPAC segment signaled a downward revision, approaching the annual trend of 27. However, it remains uncertain whether the recent momentum will continue on a lower trajectory.

The decline in tonne-days continued in the Capesize segment, whereas the Panamax segment appears to have stabilized following the previous week's downward revision.
Capesize: The growth rate has dropped to its lowest level in a year, with February expected to close on a steep downward trend.
Panamax: Tonne-day growth has remained consistent with previous weeks, while market estimates suggest a further downturn by month-end.
Supramax: The growth rate remains the strongest among vessel size categories, sustaining a steady upward trajectory since early February.
Handysize: Its growth rate remains above that of the Panamax segment, having reached its lowest point at the end of Week 3.

Congestion at Chinese dry bulk ports tempered the sharp downward trend seen across the Capesize, Panamax, and Supramax vessel segments in the preceding weeks of January and February.
Capesize: Capesize vessel congestion fell below 100, marking a decrease of 22 compared to the end of the previous year.
Panamax: The number of Panamax vessels remained steady at approximately 150, marking a decline of 30 compared to early February figures.
Supramax: Congestion levels dropped around 260 vessels, almost 10 lower compared to the figures recorded in the previous week.
Handysize: Congestion levels fell below 170, registering a decline of over 10 compared to the previous week.
Data Source: Signal Ocean Platform