

Tanker - Weekly Market Monitor
Snapshot of Crude and Product Freight Rates, Supply-Demand
Week 36, September 05, 2024
Chart of the Week: VLCC Dirty Tonne Days Growth for All Destinations and from the AG to China
This week’s special focus is on the growth of VLCC dirty tonne days from all origin countries to all destinations (left chart). In August, we observed a decreasing trend, reflecting a pattern similar to the previous year, when the market also experienced a downward trend during this period. However, the overall growth in tonne days from all origin countries to all destinations was weaker compared to the previous year.
In contrast, the trend for VLCC dirty tonne days from the AG to China (right chart) shows signs of optimism in early September. Here, we are witnessing an increase in levels that surpass those of the previous year. This suggests a potential rebound or strengthening in the market segment.
Looking ahead, it will be crucial to monitor how the transition from the summer to the winter season impacts the growth of dirty tonne days. The shift in seasonal demand and potential increases in freight rates will be key factors in determining whether the recent upward trend can be sustained and how it will influence market dynamics in the coming months.

The first week of September has shown weaker momentum for both dirty and clean freight market rates. The supply trend, which is expected to be a challenging factor in the coming days, has recorded an increase. Notably, in the MR clean segment, there has been a surprising upswing, pushing levels above the annual average. Meanwhile, VLCC Ras Tanura levels are approaching the annual average, indicating potential shifts in market dynamics. It remains to be seen whether this trend in tonne days growth will be driven by increasing demand and translate into higher freight market rates.
In the oil market, concerns about robust crude oil demand persist. The market continues to be influenced by pessimistic sentiment, overshadowing the Organization of Petroleum Exporting Countries’ (OPEC) efforts to stabilise prices. According to an ANZ Bank note released on Thursday, the OPEC+ alliance is close to agreeing on halting the plan to phase down output cutbacks. This report offered some temporary relief to the markets.
However, fears of weaker demand have resurfaced, pushing prices lower. These concerns were exacerbated earlier this week by disappointing economic data. The Federal Reserve also reported declining economic activity in the United States. Despite speculation about potential monetary policy easing, investor response remained muted, as noted by ANZ Bank. Overall, the interplay between freight market trends and broader economic indicators will be crucial in shaping future market movements. The response to supply dynamics and oil market developments will likely influence both freight rates and broader economic stability in the near term.

The sentiment in the dirty freight market appears to be weakening in early September, with the Aframax cross-Mediterranean route showing even softer momentum compared to August levels this week.
The VLCC MEG-China freight rates fell to 45 WS, a weekly decline of 2%, although still up 23% compared to the same week last September.
Suezmax freight rates for shipments from West Africa to continental Europe have returned to around 75 WS, showing momentum similar to that seen at the end of August. However, current levels are now 6% weaker than the previous week.Similarly, rates on the Suezmax Baltic-Mediterranean route have shown a weakening trend, settling at 78 WS, which represents an 18% decrease for the month.
Aframax Mediterranean freight rates are hovering around WS100, marking a 30% decline compared to the same week last month.

LR2 AG freight rates have steadily declined since early July, currently hovering around WS117. This marks a 22% drop over the past month and a 15% decrease compared to the same week last year.

Panamax Carib-to-USG rates have dropped to WS150, marking a 20% decline from the levels recorded just a month ago.

MR1 rates for shipments from the Baltic to the continent have reached WS160, reflecting a 3% weekly increase. However, they remain 16% lower compared to the same period last year. Meanwhile, MR2 rates for shipments from the Continent to the USAC are hovering around WS120, showing a 2% increase week-over-week but still 40% lower than the levels seen in the same week last year. On the USG-Cont route, MR2 rates have remained steady, hovering around WS150, similar to last month's levels, and reflecting an 11% increase year-over-year.

The supply trend for crude tankers shows an increasing trend in early September, flirting to surpass the annual average in the VLCC Ras Tanura and Suez West African, while in the Aframax Med, levels are already hovering above the annual trend.
VLCC Ras Tanura: The number of ships now stands at 74, matching the annual average and representing an increase of nearly 13 from the levels observed four weeks ago.
Suezmax Wafr: The current ship count stands at 57, showing signs of a potential increase above the annual average of 60. This week's levels are 7 ships higher than two weeks ago.
Aframax Med: The number of ships has increased to 13, surpassing the annual average and representing nearly a 50% rise compared to two weeks ago.
Aframax Baltic: Since the end of week 32, there has been a downward trend, with current levels at around 24, 10 below the annual average.
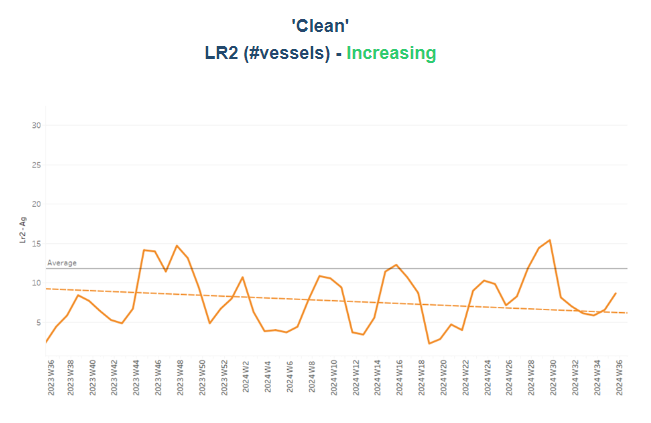

Clean LR2 AG Jubail: The upward trend in the number of vessels observed in early August appears to be resuming in the first week of September, with the count recently rising to 9. However, this remains below the annual average, and the overall trend suggests a potential decrease in the coming days.
Clean MR: Vessel activity for MR1 at Algeria's Skikda unexpectedly surged above 40 in early September, nearly 13 more than the lowest level observed at the end of week 30. Similarly, MR2 activity in Amsterdam has shown a notable gradual increase since the end of week 34, recently reaching 50—about 20 more than the annual average.

Dirty tonne days: The decrease in VLCC tonne days growth observed in August continues into early September. Meanwhile, Suezmax tonne days show stronger signs of weekly percentage growth, though this increase remains significantly below the annual average. In the Aframax segment, the decline is less pronounced, with the lowest weekly percentage growth recorded recently and a slight rise noted during week 28.

Panamax tonne days: The growth rate recorded a weekly percentage increase from the low observed in week 30. For Clean MR tonne days, the growth rate for MR1 vessel size continued to decline, with the last peak occurring at the end of week 30. In contrast, the growth rate for MR2 vessel size remains below the annual average, with not yet signs of potential upward momentum in the early days of September.
Data Source: Signal Ocean Platform