

Act II – "April hath put a spirit of youth in everything."
For nearly two years, China's daily Covid-19 cases rarely extended into three digits, and often weeks went by without a single case. China's zero-Covid policy had been among the strictest approaches to tackling the pandemic anywhere in the world. Even as the rest of the world struggled to contain the more transmissible new variants, China remained largely untouched.
All that changed in early April though, as multiple local outbreaks across the world’s second largest economy resulted to the largest surge in China's local infections. Beijing city introduced its most meticulous Covid-19 controls since the early stages of the pandemic, trying to stop the explosion of Omicron cases in other parts of China reaching the capital. The municipal government announced draconian measures after more than 200,000 infections were reported across China since the start of the outbreak on March 1. Beijing only had 64 Covid-19 patients under treatment, but Shanghai recorded more than 120,000 local infections since March 1, while more than 62,000 had been reported in the northeastern car-making and corn-producing province of Jilin. Despite growing public anger over quarantine rules in the city, authorities extended a lockdown in Shanghai to cover all of the financial center’s 26 million people.
At the same time as several cities were placed under varying levels of lockdown, activity in China’s services sector contracted at the steepest pace in two years in March. The Caixin services purchasing managers’ index (PMI) took a dive to 42 in March from 50.2 in February, dropping below the 50-point mark that separates growth from contraction on a monthly basis. The reading indicated the sharpest activity decline since the initial onset of the pandemic in February 2020. In a similar vein, the Purchasing Manager Index (PMI) of China's manufacturing industry was 49.5 percent in March, lower than the threshold and down 0.7 percentage point from the previous month. From the perspective of sub-indices, the production index was 49.5 percent, down 0.9 percentage point from the previous month, indicating a decline in manufacturing production. The new order index lingered at 48.8 percent, down 1.9 percentage points from the previous month, indicating a weaker demand for the manufacturing industry.
In contrast to the above concerning data for the path of Chinese economy, domestic coal industry seemed to be in an expansionary mood. In particular, raw coal production increased rapidly in the first couple of months of 2022. For January and February, 690 million tonnes of raw coal were produced domestically in China, with a substantial year-on-year increase of 10.3 percent. With the average daily output lingering at 11.64 million tonnes, imported coal was just 35.39 million tonnes during the first two trading months, or down 14.0 percent. China’s state planner set a target for daily coal output at 12.6 million tonnes for 2022, higher than a previous peak of 12.4 million a day set in December. With increased domestic production having a negative bearing in imports, the Pacific market was not exactly busy during the fourteenth trading week. On top of that, the uncertainty surrounding Russian and Ukrainian commodity exports created further turbulence in the market. Given the above, it is hardly surprising that all Baltic indices were in the red that week.

In mid-April, World Trade Organization revised downward its projections for world trade over the next two years. The Genevabased organization expected merchandise trade volume growth of 3.0 percent in 2022 – materially down from its previous forecast of 4.7 percent. The latest estimates based on the WTO Global Trade Model captured (1) the direct impact of the war in Ukraine, including destruction of infrastructure and increased trade costs; (2) the impact of sanctions on Russia, including the blocking of Russian banks from the SWIFT settlement system; and (3) reduced aggregate demand in the rest of the world due to falling business/consumer confidence and rising uncertainty. Under these assumptions, world GDP at market exchange rates was expected to grow by 2.8 percent in 2022, down 1.3 percentage points from the previous forecast of 4.1 percent.
The most immediate economic impact of the crisis was a sharp rise in commodity prices. In a period when inflationary pressures were already the main theme in most of the economies, increased commodity prices came to add further fuel on that trend. In fact, the US consumer price index jumped 8.5 percent in March from 12 months earlier, the sharpest year-over-year increase since December 1981! Prices had been driven up mainly by robust consumer demand, bottlenecked supply chains and disruptions to global food and energy markets worsened by Russia’s war against Ukraine. From February to March, inflation rose 1.2 percent, the biggest month-to-month increase in the last seventeenth years.
In this juncture, James Bullard, president of the St Louis branch of the Fed, said the central bank needed to be more aggressive in its efforts to root out the highest inflation in four decades as he called for rates to rise to a point where they actively curtail growth. On the same wavelength, Eurozone inflation surged to an all-time high of 7.5 percent in March, further intensifying the European Central Bank’s policy challenge as it seeks to fight spiraling prices without hurting growth. For months, inflation had raced ahead of the ECB’s target and was more than triple the 2 percent seen as guaranteeing price stability.
The war was not the only factor weighing on world trade and inflation, according to WTO. Lockdowns in China to prevent the spread of Covid-19 were again disrupting seaborne trade at a time when supply chain pressures appeared to be easing. That could lead to renewed shortages of manufacturing inputs and higher inflation as well. Indicative of the aforementioned was that China’s truck traffic dropped 40 percent since mid-March, while truck movement around Shanghai was down to 15 percent of its normal level. Logistics operators and exporters faced delays in delivering cargo domestically and overseas amid travel restrictions. In a time when stricter lockdowns in China and restrictive monetary policies in the US and EU seemed to be the new reality Baltic indices had to face, an expansionary policy from Beijing would be more than welcome.
In mid-April, China’s State Council said in a statement after a regular meeting chaired by Premier Li Keqiang that “In light of changes in the current situation, we will encourage large banks with higher provisions to lower provision ratios in an orderly manner and will use monetary policy tools, including RRR cuts, in a timely way.” In spite of the positive note of Chinese monetary policy, news kept arriving from the macro front was anything but supportive. In particular, the International Monetary Fund lowered its forecast for global economic growth to an estimated 6.1 percent in 2021 and to just 3.6 percent in 2022 and 2023. That corresponded to 0.8 and 0.2 percentage points lower for 2022 and 2023 than in the January World Economic Outlook Update.

As far as the Russo-Ukrainian conflict goes, a severe double-digit drop in GDP for Ukraine and a large contraction in Russia and Belarus were more than likely, along with worldwide spillovers through commodity markets, trade, and financial channels. In reference to the world’s second largest economy, slowing growth in China’s economy had wider ramifications for Asia and for commodity exporters. The combination of more transmissible variants and a zero-Covid strategy entail the prospect of more frequent lockdowns, with attendant effects on private consumption in China. Additionally, policy space in many countries eroded by necessary higher Covid-related spending and lower tax revenue in the previous couple of years. In that juncture, fiscal support was set to generally decline in both 2022 and 2023. Faced with rising borrowing costs, governments were increasingly challenged by the imperative to rebuild buffers.
In many countries, inflationary pressures had become a main concern. In some advanced economies, including the United States and some European countries, it had reached its highest level in more than 40 years. Furthermore, there was a rising risk that inflation expectations become de-anchored, prompting a more aggressive response from central banks. In emerging market and developing economies, increases in food and fuel prices could significantly increase the risk of social unrest. Inflation was expected to remain elevated for longer than in the previous forecast, with IMF stressing the incremental impact of war-induced commodity price increases to an already inflationary environment.
In particular and for 2022, inflation was projected at 5.7 percent in advanced economies and 8.7 percent in emerging market and developing economies — 1.8 and 2.8 percentage points higher than what was projected in January. Elevated inflation would complicate the tradeoffs central banks were facing between containing price pressures and safeguarding growth. Against this backdrop and reflecting the significant slowdown in overall activity, global trade growth was expected to decline notably to 5 percent in 2022 and further to 4.4 percent in 2023 – 1 and 0.5 percentage points lower than in the January forecast.
In the tug-of-war between unfavourable macro fundamentals pulling from the one side and auspicious seasonality from the other, Baltic indices needed once again to walk along a thin rope. Being known as one of the most famous tightrope artists, Baltic Dry Index was seeking to near the yearning seasonality end, without losing its poise. In sharp contrast, headlines in the Western hemisphere were anything but cheerful during the seventeenth week. From the unexpected US first economic contraction since mid-2020 to the softer economic growth in the eurozone, the tone in the markets was quite dull. In sync, China’s economy reeled from severe Covid19 lockdowns, forcing Beijing to introduce afresh supportive measures in order to avoid a hard-landing scenario.
The US economy contracted unexpectedly in the first quarter, as a record-high trade imbalance and weaker inventory growth masked strong spending by American consumers and businesses, according to the US bureau of economic analysis. In particular, real gross domestic product decreased at an annual rate of 1.4 percent in the first quarter of 2022, well below market forecasts of a 1.1 percent expansion and following a 6.9 percent growth in Q4 2021. The decrease in real GDP reflected decreases in private inventory investment, exports, federal government spending, and state and local government spending, while imports, which are a subtraction in the calculation of GDP, increased. With inflation lingering at multidecade highs, the GDP report was unlikely to change the Federal Reserve’s plans to raise interest rates rapidly this year.

In sync, Eurozone economy slowed as inflation increased to 7.5 percent. In the first quarter 2022, seasonally adjusted GDP increased by 0.2 percent in the euro area and by 0.4 percent in the EU, compared with the previous quarter, according to a preliminary flash estimate published by Eurostat. In the fourth quarter of 2021, GDP had grown by 0.3 percent in the euro area and 0.5 percent in the EU. Compared with the same quarter of the previous year, seasonally adjusted GDP increased by 5.0 percent in the euro area and by 5.2 percent in the EU in the first quarter of 2022, after +4.7 percent in the euro area and +4.9 percent in the EU in the previous quarter. Zooming out, eurozone economy navigated through a turbulent quarter, yet still managing to eke out a small positive growth number. With the Omicron impact milder than expected and the war in Ukraine having an increasing impact from early March onwards, eurozone managed to avoid contraction this quarter, with the outlook for 2Q remaining pretty muddy tough.

In the Pacific, China’s economy had been hit hard by waves of the coronavirus, urging leaders to push for timely tax cuts and other support policies. The complexity, severity and uncertainty of China's economic development environment have increased," the Politburo was quoted as saying by the official Xinhua news agency. "Stabilising growth, employment and prices are facing new challenges. It is very important to do a good job in economic work and effectively protect and improve people's livelihood," Xinhua reported. China’s top leadership vowed on the last Friday of April to speed up the implementation of existing tax-cut and supportive policies, as well as the use of new monetary policy tools and effective investment. In this juncture with roiling geopolitical games and ensuing economic uncertainty being the focal point, Baltic indices seemed to be rather hesitant in setting clear course. However, the leading Capesizes ended April on a positive note at $17,713 daily, having left the low teens behind.
In a rather choppy week for most of the markets around the globe, May started with the Federal Reserve raising the target for the fed funds rate by half a point to 0.75-1 percent - the second consecutive rate hike and the biggest rise in borrowing costs since 2000. It was the first time in 22 years that the central bank had hiked rates this much. The decision was unanimous, with all 12 members of the policy-setting Federal Open Market Committee agreeing on it. In addition, the Committee decided to begin reducing its holdings of Treasury securities and agency debt and agency mortgage-backed securities on June 1, shrinking the size of the Federal Reserve's balance sheet. In his post-meeting press conference, Fed Chairman Jerome Powell stressed that additional half-percentage-point rate hikes would be on the table for the next few meetings. After acknowledging that inflation was much too high, Fed Chairman stated that "We are moving expeditiously to bring it back down." However, with the Russia-Ukraine conflict still raging, price pressures on food and energy were unlikely to abate any time soon. Additionally, the bank also warned that the pandemic-related lockdowns in China will likely weigh on already battered supply chains.
However, China’s zero-tolerance approach to Covid-19 did not only have a negative bearing on global supply-chain, but also on the course of the world’s second largest economy itself. In fact, China's factory activity saw a decline in April, as the spread of Covid-19 led some enterprises to reduce or halt production, while the nonmanufacturing sector also slowed in the same period, data from the National Bureau of Statistics showed. The impact of lockdowns on business was underlined that week by publication of the purchasing managers' index (PMI) for China's manufacturing sector. In particular, China's manufacturing PMI further dropped by 2.1 percentage points to 47.4 in April, marking the lowest figure since February 2020. The non-manufacturing segments took also a 6.5- percentage-point dive to just 41.9.

Despite the contraction in many industries, Chinese official sources voiced positiveness to the outlook, saying that with the effective control of the epidemic and the emergence of policy effects, corporate expectations were regarded to gradually improve. Whilst the locomotive of global growth seemed to be in a quite challenging crossroad, Baltic indices found the courage to steam north during the eighteenth week, with BCI TCA balancing at $24,002, BPI82 TCA at $28,572, BSI TCA at $30,024 and BHSI TCA at $29,516 daily.
At the same time as stock markets around the globe were reassessing their valuations based on a new "hawkish" reality, Chinese international trade data were the focal point of the shipping community. China's export growth softened to single digits - the weakest in almost two years - while imports remained unchanged in April as tighter and wider Covid-19 lockdowns had a negative bearing on factory production and domestic demand. In reference to the dry bulk commodities, in specific, Chinese customs cleared 86.06 million tonnes of iron ore in April, 12.7 percent less than a year earlier, implying ongoing weak activity in the country's steelmaking industry. Total production of top miners, including BHP, Rio Tinto and Fortescue Metals Group in Australia, had been disrupted by supply-chain bottlenecks and pandemic-induced labour shortages, while Brazil's Vale had also had weather-related issues.
In April, the Baltic Capesize TCA reported an average value of $14,020 daily, or some 53 percent lower year-on-year. However, the most capricious segment of the dry bulk sector had been in a better mood in early May, balancing above the $30,000-mark. In JanuaryApril, China imported 354.4 million tonnes of iron ore, down 7.1 percent from the respective period a year ago. During the same period, Capesizes were running at $14,578 daily on average, or 27.8 percent lower than the average of the first four months of 2021.
As far as the other two major commodities of the dry bulk spectrum go, China's soybean imports fell in April at the same time as coal imports were surging, yet still both remaining lower for the whole January-April period on a year-on-year basis. In particular, China took in 23.55 million tonnes of coal last month, data from the General Administration of Customs showed in mid-May. That compared with 16.42 million tonnes in March and 21.73 million tonnes in April 2021. During the first four months though, China brought in a total of 75.41 million tonnes of the least loved commodity, or down some 16 percent from shipments in the same period a year earlier. Clearly, China’s coal imports had been negatively affected by Beijing’s decision to prioritise energy security in the wake of geopolitical uncertainties caused by the Ukraine conflict, targeting a materially higher daily domestic coal production of 12.6 million tonnes. On the same wavelength, the world’s largest soybean importer brought in 8.08 million tonnes of oilseed in April, or up by 27 percent from 6.35 million in March, according to data from the General Administration of Customs. The aforementioned figure was distorted though as poor weather conditions and slow harvests in South America caused delays in the arrivals of March cargoes. April’s reading was also up from 7.45 million tonnes in the same month a year earlier. In the first four months of the year, China imported 28.36 million tonnes of soybeans, marginally lower by 0.8 percent than 28.59 million in the previous year. In spite of the lukewarm Chinese trade data, April was a quite active trading month for the Panamax segment, with the BPI 82 TCA reporting a monthly average of $26,517 daily or up 23 percent year-on-year.

At a time when Baltic indices were trying to lift from their Q1 lows, consumption and production data from China kept injecting uncertainty in the dry bulk market. China’s economy slowed sharply in April as Beijing’s draconian “dynamic zero Covid-19” strategy dragged consumption and industrial production to their lowest levels since early 2020. In particular, the total value of retail sales of consumer goods during the last month lingered at 2,948.3 billion yuan, down by 0.69 percent month-on-month. With millions of Chinese being under some form of lockdown, retail sales dropped 11.1 percent compared with the previous year. The aforementioned reading was sharply worse than March’s 3.5 percent contraction. In the first four months, the total retail sales of consumer goods reached 13,814.2 billion yuan, marginally lower by 0.2 percent yearon-year. As lockdowns forced factories to suspend operations and disrupted supply chains, industrial production took a 2.9-percent dive in April from a year earlier, compared with a 5 percent gain in March, indicating the largest decline since February 2020. In the first four months, the total value added of the industrial enterprises above the designated size grew by 4.0 percent year-on-year, 2.5 percentage points lower than that of the first quarter.

Additionally, China’s electricity output plunged in April as virus restrictions in Shanghai and other parts of the country negatively affected economic activity from steel mills to shopping malls. In particular, electricity generation dropped in April from the prior month to 608.6 billion kilowatt-hours, a decline of 4.3 percent on the same period last year. Thermal power output plummeted to an even greater degree, down 12 percent for the biggest drop since 2008, as the share of renewables increased at the expense of coal and gas.
Furthermore, property sales by value in April slumped 46.6 percent from a year earlier – the biggest drop in the last 16 years - according to Reuters calculations based on data from the National Bureau of Statistics. The sector – a key pillar of the Chinese economy - had been in a severe slump since last year after the authorities clamped down on excessive borrowing by developers. In the first four months, property sales by value fell 29.5 percent year-on-year, compared with a 22.7 percent decline in the first three months.
With China’s pillars of growth wobbling, Baltic indices pinned all hopes for the upcoming months on seasonality. As far as the twentieth trading week goes, the Dry Baltic Index reported strong gains. However, the last trading week of May saw Baltic Capesize indices being in a freefalling mode. After steaming for eleven trading days north of the 3000-point-mark and touching five-month highs on the last trading Monday of May, Baltic Dry Index trended sharply downwards to a Friday 27 May closing of 2681 points. Whilst Baltic indices were losing their recent highs, market uncertainty was on a rise.
Spot market was not the only one in a reconsideration mood lately though. Stock market investors were increasingly worried about the possibility of recession in the US. Nasdaq and the leading S&P 500 indices had been in a downward trend since early January, losing some 23 and 14 percent of their values respectively. Worries that aggressive moves to curb multi-decade-high inflation might actually derail the world's largest economy dampened investors' risk appetite. The Fed, earlier that month, raised its benchmark interest rate by 0.5 percentage points, the largest increase in more than 20 years, and signaled that it would do the same at its next two meetings. In reference to the world’s second largest economy, China could struggle to record positive growth in the second quarter of this challenging year, according to China’s premier. As Covid-19 curbs squeezed firms in April, profits of China's industrial sector fell at their fastest pace in two years, with elevated raw material prices and supply chain bottlenecks squeezing margins and disrupting factory activity. While lofty commodity prices drove up the profit growth of some upstream industries – with the mining sector soaring 142 percent – manufacturing firms saw their profits dive by 22.4 percent. Overall, profits shrank 8.5 percent from a year earlier, swinging from a 12.2-percent gain in March. In this unfavourable juncture, Baltic Dry Index concluded the last full trading week of May deep in the red.
In a rollercoaster period for most of the commodities, oil wouldn't miss the ride. The price of Brent crude averaged $87.22/bbl in January 2022 as against $74.10/bbl during December 2021 and $54.84/bbl during January 2021. In an already elevated price environment, Russian invasion of Ukraine in late February was catalytic for the course of oil prices. In fact, with market reacting to supply disruptions stemming from the possibility of a ban on Russian oil and natural gas, oil prices jumped in early March. West Texas Intermediate crude futures, the US oil benchmark, at one point spiked to $130.50/bbl – its highest since July 2008. In sync, the international benchmark, Brent crude, hit a high of $139.13/bbl in early March, touching 13-year maxima. Oil was rising during March on the prospect for a full embargo of Russian oil and products. Brent’s April monthly average was $106/bbl, $7/bbl less than the March 2022 average but still $41/bbl more than April 2021. The respective monthly average for the WTI balanced at $102/bbl, similarly $7/bbl less than March 2021 and $40/bbl more than April 2021. After a lukewarm May start, oil prices returned on their upward trend in mid-May on optimism that China would see significant demand recovery after positive signs that the country's coronavirus pandemic was receding in the hardest-hit areas. Additionally, stockpiles in the Strategic Petroleum Reserve fell to 538 million barrels, the lowest since 1987, according to data from the US Department of Energy released. Oil prices ended May on a positive sign ahead of the US Memorial Day holiday weekend, the start of peak US demand season, and as European nations were negotiating over whether to impose an outright ban on Russian crude oil.
Oil prices have hit fresh highs in the first week of June after European Union leaders agreed on a plan to block more than twothirds of Russian oil imports. In fact, Brent crude rose above $123/bbl mid-week, the highest it has been for two months. US crude oil and fuel stockpiles were in downward trajectory, as demand continued to outstrip supply, with commercial crude inventories drawing down even as more strategic reserves entered the market. On Friday June 3, oil slipped after OPEC+ decided to increase production targets by slightly more than planned, although tight global supply and rising demand as China eased Covid-19 restrictions limited the decline. The Organization of the Petroleum Exporting Countries and allies, or OPEC+, increased their output boost to 648,000 barrels per day (bpd) in July and August rather than 432,000 bpd as previously agreed.

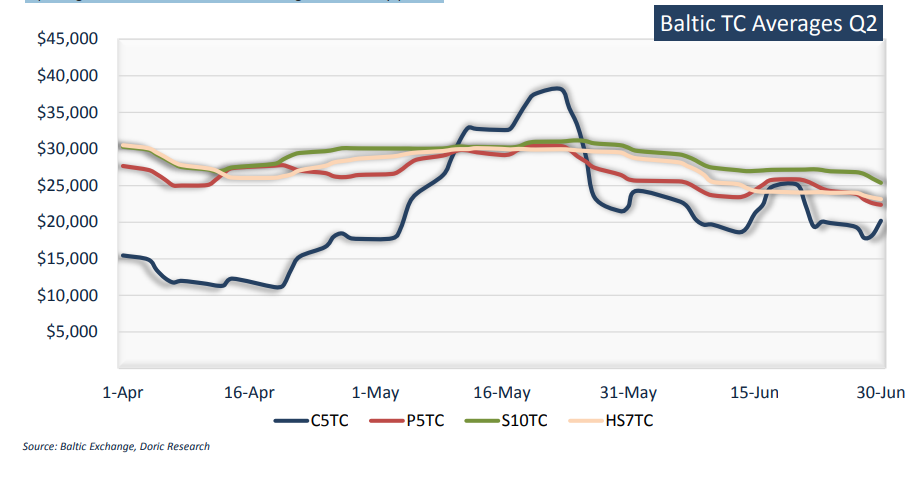
Spot market, on the other hand, was moving mostly sideways the first week of June, with BCI TCA concluding at $24,274 daily, BPI82 TCA at $25,663 daily, BSI TCA $29,738 daily and BHSI TCA $28,712 daily. Capesizes ended the week in the black, at the same time as all the other segments were drifting marginally lower. There had been several significant changes in the global economic environment in the previous months, including the worldwide spread of the Omicron variant, the greater-than-expected persistence of inflationary pressures and a faster adjustment of monetary policy in a number of major economies than previously expected, forcing the spot market to be quite cautious in terms of direction picking. Additionally, the economic impact of the war in Ukraine was perplexing things even more, blurring the outlook of the market during the summer months.
Following the acute phase of the pandemic, central banks in most advanced economies started to withdraw stimulus as the recovery progressed and inflationary pressures emerged. In the jargon of central bankers, that process was often described as bringing about a “normalisation” of monetary policy. In that “normalisation” process though, central banks would need to walk a fine line between tackling inflation and avoiding a substantial slowdown, or as Goldman Sachs brilliantly put it “the narrow path to a soft landing”. In that period when central banks had to test their tightrope walking skills, global GDP growth was projected to slow to 3 percent in 2022 and between 2.75-3 percent in 2023, with output rising by only around 2 percent over the year to the fourth quarter of 2022, according to the OECD.
Almost all countries were expected to grow more slowly in 2022-23 than was foreseen before the war. In the United States, GDP growth was anticipated to weaken from 5.7 percent in 2021 to 2.5 percent in 2022. Supply shortages, exacerbated by the war in Ukraine and Covid-related lockdowns in China, higher oil prices and a faster pace of monetary policy “normalisation” would hold back growth to a greater extent than previously foreseen. In the euro area, the war in Ukraine and the lockdowns in China added to supply-sidebottlenecks giving additional impetus to inflationary pressures and further denting real household incomes and business sentiment. GDP growth was projected to slow from 5.3 percent in 2021 to 2.6 percent in 2022. After a fast recovery from the first wave of the pandemic, China’s economy cooled, partly reflecting the strict measures that remained in place to eradicate the spread of the virus as well as weak real estate investment due to tighter regulations and the failure of some major developers. GDP growth was projected to slip to 4.4 percent in 2022 before rebounding to 4.9 percent in 2023. India recorded the strongest rebound from the Covid-related downturn of any G20 economy, but momentum was dissipating owing to weaker external conditions, rising global food and energy prices and the tightening of monetary policy. GDP growth, which reached 8.7 percent in FY 2021, was now projected to slow to 6.9 percent in FY 2022.
Setting aside the short-term impact of war in the global economy and spot market, OECD stressed that there might be longer-term consequences as well, including pressures for higher spending on defense in Europe and elsewhere, changes to the structure of energy markets, potential fragmentation of payment systems, reformulation of supply chains, and shifts in the composition of foreign exchange reserves. A re-division of the world into blocs separated by barriers would sacrifice some of the gains from specialisation, economies of scale and the diffusion of information and know-how.

In the short term, surging inflation led investors and oil traders in mid-June to brace themselves for a big move by the Fed. The world’s financial markets were preparing for the sharpest rise in US interest rates in almost 30 years. Stock and bond markets sold off sharply as unexpectedly high inflation figures raised the prospect of the Fed taking a more aggressive approach. Without any surprises, officials agreed to a 0.75-percentage-point rate rise at their two-day policy meeting that concluded on Wednesday June 15.

In a week full of monetary policy activity, the European Central Bank promised fresh support for the bloc's indebted south, tempering a market rout that threatened a repeat of the debt crisis that almost blew the single currency away a decade ago. Following an emergency meeting, the central bank’s governing council pledged to accelerate plans to create a “new anti-fragmentation instrument” and apply flexibility in reinvesting redemptions. The ECB stressed that it would direct cash to more indebted nations from debt maturing in a recently-ended 1.7-trillion-euro pandemic support scheme and it would work on the aforementioned new instrument to prevent an excessive divergence in borrowing costs. The People’s Bank of China, on the other hand, kept the interest rate of the oneyear medium term lending facility unchanged at 2.85 percent while injecting 200 billion yuan ($29.67 billion) of liquidity into the banking system, according to a statement on its website.
China’s major economic indicators improved in May, and thus China’s central bank abstained from cutting a key policy interest rate, avoiding further policy divergence from the US that could add pressure on the yuan. A ripple effect, with the Fed's sharpest rise in US interest rates in almost 30 years as the epicentre, was expanding its reach across the commodity and stock markets during the twenty-fifth week of the year. The last full week of the first half of the year started with Dalian iron ore futures plummeting by their 11 percent limit on Monday, whilst those in Singapore dropped as much as 8 percent, as concerns grew about a collapse of steel consumption in top user China.
All the latest recession rhetoric coupled with a projected slowdown in construction activity during the rainy season in China and weak profits at mills didn’t leave much room for positivity in the iron ore markets. Against this backdrop, the forward market of the dry bulk sector was under severe pressure, with July and August contacts freefalling. Spot market followed closely, being in the red for the most part of the week. Even though Baltic indices might turn deaf to macroeconomic calls for a certain short period of time, they rarely remain unaffected from FFA market ebbs and flows.

Whilst freight market was trying to reassess its levels, not being yet sure if sector-specific dynamics would manage to overcome a quite ominous macroeconomic environment, “Dr. Copper” didn’t seem to have second thoughts. In fact, copper prices were set for their biggest weekly fall in a year, as investors worried that efforts by central banks to tame inflation will stifle economic growth and reduce demand for metals. In fact, the most-traded July copper contract in Shanghai fell 3.5 percent to 64,080 yuan ($9,572.47) a tonne today, or down 7.9 percent week-on-week. Other industrial metals tumbled as well, with nickel down circa 13 percent that week and tin off 25 percent, their biggest weekly slump since 2005.
As yet another profitable first year halves concluded, sentiment of the dry bulk sector remained rather mixed. With BCI 5TC averaging at $14,019, BPI-TCA at $26,517, BSI 58-TCA at $28,800 and BSHI-TCA at $27,856 daily, April’s average values had a positive bearing on market psychology, mainly due to an impressive performance of the geared sub-markets. The following month saw Capesizes adding further fuel to a monthly average of $29,140 daily, whilst all other segments followed through. In tandem, Kamsarmaxes had an average of $28,785 daily during this period. Similarly, BSHI-TCA trended mildly upwards to a solid May average of $29,719 daily, at the same time as BSI-TCA was reporting further gains at $30,458 daily. June, on the other hand, reversed these tendencies, with Baltic indices losing some of their steam. Capesizes balanced for several days below the $20,000-mark, reporting a June average of $20,884 daily. Kamsarmaxes and Handies lost circa $4,000 of their values to a monthly average of $24,437 and $25,029 daily respectively. Being the star performers for the month of June, Supramaxes had a monthly average of $27,361 daily, yet still remaining below their recent highs. Overall, the first half of 2022 was a rather fertile one, but lacking last year Capesizes’ vibrancy. With geared segments stealing Capesize thunder and being in the front seat, spot market managed to hover at solid levels during the previous six months.
On the S&P front, having an average price for the H1 of 2022 of $43m, run-of-the-mill five-year-old Capes were on the market at circa eight point five million dollars above their H1 five-year average. Having a seven-million higher price tag, eco five-year-old Capes had a H1 average of $50m. Modern Kamsarmaxes had an average price of $36m during the last six months, or $10m above the respective average of the last five years. Moving down the ladder to the geared tonnage, market for five-year-old Ultras and same-aged large Handies lay on average at $33m and $28m respectively, or some 41 percent and 48 percent above the average prices of the H1s between 2018 and 2022.
As yet another profitable first year halves concluded, sentiment of the dry bulk sector remained rather mixed. Those who were expecting an economic slowdown due to tighter monetary policies had seen the Russian invasion of Ukraine amplifying the aforementioned shift in global financial conditions. On the other hand, those focusing on the supply side discipline witnessed a rather buoyant market determined to remain as such, paying macroenvironment no mind. In this crossroad, dry bulk indices had yet to decide whether to follow the grey macroeconomic outlook or to focus on the rosier sector-specific factors.
Act III – "’Tis not enough to help the feeble up, but to support them after."
The first trading week of the third quarter saw Baltic indices steaming further south, with the Baltic Dry Index balancing midweek at three-month minima. Growing concern that out-of-control inflation, rising interest rates and slowing growth could join forces to tip the world into recession had a negative bearing on market activity. As in every time when discussions surrounding the possibility of recession flare up, all eyes were on the shape of the US yield curve and in particular on the ten-two treasury yield spread. The yield curve is usually upward sloping, whereby a higher fixed rate of return is earned from lending money for longer periods of time. Shorter-term yields tend to represent what investors believe will happen to central bank policies in the near future. Longer-dated maturities represent investors’ best guess at where inflation, growth and interest rates are headed over the medium to long term. From an economic perspective, an inverted yield curve is a noteworthy and uncommon event because it suggests that the near-term is riskier than the long term. A negative spread has historically been viewed as a precursor to a recessionary period. In fact, a negative ten-two spread has predicted every recession from 1955 to 2018, with a contraction following between six and twenty-four months, and is thus seen as a far-leading indicator.
The two-to-ten-year segment of the yield curve inverted in late March for the first time since 2019 and again in June. In early July, yields on two-year Treasuries rose as high as 2.95 percent, while the ten-year stood at 2.94 percent. The two-year, five-year part of the curve also inverted for the first time since February 2020. The aforementioned inversion suggested that while investors expected higher short-term rates, they might be growing nervous about the Fed’s ability to control inflation without derailing the economy. Fed, however, found a new ally on its attempt to tame the highest inflation in the last forty years.
After touching historic highs earlier this year, commodity prices were moving down, with investors reversing bullish bets on everything from corn to copper and oil in the latest sign of recession fears gripping financial markets. In particular, oil prices were trending downwards in the previous weeks, landing at multi-month lows. In sync, copper prices sunk to their lowest in almost 20 months as persistent worries that a recession would dampen metals demand hit a market with thin summer volumes. Iron ore took a hit as well to its lowest level this year in Singapore, as China was facing fresh Covid-19 flare-ups in several areas including Shanghai. Other commodity markets also faced severe falls, with the broad S&P GSCI agricultural prices index down 28 percent since its all-time high in mid-May. In this unstable economic environment where commodity prices kept falling, it came as no surprise that trading activity in the dry bulk spectrum was rather dull in early July.

Apart from some glimpses of hope stemming from headlines of a possible stimulus package in China, the twenty-eighth trading week was a rather dull and uninspiring one. China’s Ministry of Finance stressed that Beijing was about to allow local governments to sell 1.5 trillion yuan ($220 billion) of special bonds in the second half of this year. The debt would mostly be used to pay for infrastructure spending, a good old recipe that policy makers are using to boost an economy hit by Covid lockdowns and a housing slump. Following the news, Dalian iron ore recouped from a selloff in the previous sessions at the same time as copper prices reported strong gains. However, Baltic indices weren’t convinced that these liquidity injections would suffice. Indicatively, BPI 82 TCA had been balancing below the $20,000-mark in the previous five days, for the first time since early February. BSI 10 TCA and BHSI 7 TCA, on the other hand, had been hovering above $20,000 per day during the second week of July, yet still both reported considerable losses on a week-onweek basis. BCI TCA was the only Baltic index in the green, bouncing back to $20,000 daily.
On the macro front, once again, the US inflation quickened to 9.1 percent from a year earlier, climbing 1.3 percent from May. Energy prices rose 41.6 percent, the most since April 1980. Food costs surged 10.4 percent, the most since February 1981, with food at home jumping 12.2 percent, last seen on April 1979. The so-called core CPI, which strips out the more volatile food and energy components, advanced 0.7 percent from the previous month and 5.9 percent from a year ago. All the aforementioned figures were standing well above analysts’ forecasts and market consensus. It was widely anticipated that the central bank was going to increase interest rates by 0.75 percentage points later this month and could well consider as much as a 1 percentage point rise. These high inflation levels, and the monetary policy reaction they would entail, shaped certain gloomy expectations for most of the markets across the globe. Commodity prices kept deflating across the board, touching multi-month low in most markets. Among them, US wheat futures reported material losses, balancing to their lowest for the third quarter backed by expectations for a deal that could lead to the resumption of Ukrainian Black Sea grain exports.
In this macro environment, China reported a sharp slowdown in its commodities imports in June as the world’s second largest economy saw a slow recovery from the widespread Covid-19 lockdowns. In fact, China's June soybean imports fell by some 23 percent year-onyear to 8.25 million tonnes, as high global prices and weak demand curbed importers’ appetite for the protein-rich seeds. Shipments from Brazil began slowing in April and May as buyers eyed falling crush margins. As far as minerals go, China's iron ore imports in June fell modestly from a year earlier, due to weaker demand from the steel-making industry. The world's top iron ore consumer imported 88.97 million tonnes of iron ore last month, easing 0.5 percent from 89.42 million tonnes in June 2021, according to the General Administration of Customs. Iron ore imports slumped from March to April, as Brazil's Vale halted iron ore train operations due to heavy rain while miners in Australia suffered from pandemic-induced labour shortages. Additionally, Chinese steel companies were suffering from weak margins and high inventories, disincentivising any increase in production. In a similar vein, China's coal imports plummeted by 33 percent in June from a year ago, with traders turning down expensive overseas cargoes in favour of domestic ones. In particular, China imported 18.98 million tonnes of coal in the previous month, compared to 28.93 million tonnes in June 2021. Over the first half of 2022, China imported 115 million tonnes of the fuel, or a whopping 17.5 percent lower than a year ago.

Whilst data from the Chinese customs were pointing to a significant slowdown, ECB followed Fed on its hawkish flight. The central bank of the euro area delivered its first interest rate hike in over a decade in the third week of July. Joining other major central banks in the race to get on top of galloping inflation, ECB dared greatly with a 50 basis-point hike, ending the negative rates era. The aggressive ECB decision showed how the world’s monetary authorities were shifting their policies to confront surging prices even as signs of a coming global recession multiply. The United States, Canada, New Zealand and Switzerland among others lined up in the previous weeks with aggressive rate rises. In this juncture, ECB's decision was aligned with the monetary stance of the rest of the OECD economies.
With Russia squeezing natural gas supplies to Europe, Italy being in the eye of a political crisis and record inflation eroding household spending across the continent, the outlook for the eurozone worsened during the trailing few months. Even though the relative importance of the European continent in the dry bulk trades is not the one it used to be long time ago, a shaky economic outlook of the bloc can have a negative indirect impact on the staple trade runs. That being said, governments in Europe announced that several coal-fired power plants would be returned to service while the planned retirement dates for other plants would be delayed. Additionally, Kiev and Moscow agreed a “de facto ceasefire” on cargo ships that would finally carry the stranded grains from Ukrainian ports. Although that could offer a boost in the Black Sea trades, concerns from diplomatic channels should be taken into account as to how this initial agreement will deploy in the field. Whilst the latter might light a glimmer of hope for the drybulk sector, the unfavourable European macroeconomic environment did not allow market sentiment to convincingly warm up.
Whilst the US were still in a debate whether two consecutive quarters of decline in a country's real gross domestic product should be used as a practical definition of a recession or not, the IMF slashed its global growth forecasts and raised its projections for inflation, warning that the risks to the economic outlook are “overwhelmingly tilted to the downside”. In particular, IMF's baseline forecast was for growth to slow from 6.1 percent last year to 3.2 percent in 2022 – 0.4 percentage point lower than in the April 2022 World Economic Outlook. Lower growth earlier this year, reduced household purchasing power, and tighter monetary policy drove a downward revision of 1.4 percentage points in the United States. In China, further lockdowns and the deepening real estate crisis have led growth to be revised down by 1.1 percentage points, with major global spillovers.
In Europe, significant downgrades reflect negative externalities from the war in Ukraine and tighter monetary policy. In reference to the main theme of the current trading year, global inflation was likely to intensify, with the IMF raising its forecasts for this year and next by nearly a full percentage point to 8.3 percent and 5.7 percent, respectively. It was anticipated to reach 6.6 percent in advanced economies and 9.5 percent in emerging market and developing economies this year – upward revisions of 0.9 and 0.8 percentage point respectively. In the early 1980s, disinflation episodes were often costly, with high unemployment being the price of taming inflation. In the current juncture, lower starting inflation levels, lower and better-anchored inflation expectations, and the greater flexibility of labor and product markets in advanced economies suggest that costs may be lower. However, higher sovereign and corporate leverage may amplify the effects of policy tightening and influence the willingness of central banks to act decisively on inflation, with potentially higher medium-term output costs.

In that macro environment how odd would it be for Baltic indices to keep their sterns afloat? Being, in fact, in sync with the underlying grey economic juncture, Baltic Dry Index concluded lower the last week of July at 1895 points, with all sub-markets in the red. August started with US House Speaker Nancy Pelosi landing in Taipei and marking a significant demonstration of support towards Taiwan despite China's warnings of retaliation over the visit. Pelosi and the congressional delegation that accompanied her stressed in a statement that the visit "honors America's unwavering commitment to supporting Taiwan's vibrant democracy."
As Beijing stepped up military drills and warplane incursions around the island, China's Ministry of Foreign Affairs said that "U.S. House Speaker Nancy Pelosi insisted on visiting Taiwan in disregard of China's serious concerns and firm opposition, seriously interfering in China's internal affairs, seriously undermining China's sovereignty and territorial integrity, seriously trampling on the one-China principle, and seriously threatening the peace and stability across Taiwan Strait." At the same time as Taiwan's export-oriented industrial economy had to take into serious consideration the aforementioned geopolitical games, Chinese manufacturing activity was taking another dive. In particular, the purchasing managers’ index (PMI) for China’s manufacturing sector came in at 49 in July, down from 50.2 in June.
Negative impacts including the traditional production offpeak period, insufficient market demand, and the weakened performance of energy-intensive industries weighed on the industry, according to NBS senior statistician Zhao Qinghe. Further to Chinese official PMI discouraging reading, the total profit of manufacturing industry in China was 3,189.31 billion yuan, or down some 10.4 percent year-on-year. With profits tumbling, China's daily pig iron and crude steel output dropped to 2.311 million mt and 2.670 million mt during July 21-31, down 6.2 percent and 5.9 percent from July 11-20 respectively, according to data released by the China Iron & Steel Association Aug. 4. In the first half of 2022, China’s crude steel output was 527 million mt, a year-on-year decrease of 6.5 percent, with a cumulative daily output of 2.9109 million mt. The CISA estimated daily pig iron and crude steel output in July at 2.379 million mt/d and 2.725 million mt/d, down 7.2 percent and 9.9 percent from June respectively.
The aforementioned steel output cuts were expected to support domestic steel prices, which had fallen steeply in the last three months due to weak demand and supply glut. However, any rebound in prices could only be marginal, as steel mills would limit steel output cuts as soon as steel profit margins recover. Capesizes, on the other hand, were by no means in a rebounding mood during the thirty-first trading week, concluding at a demoralizing three-anda-half-month low of just $11,700 daily. With demand outlook remaining clouded by increasing worries about an economic slump in the United States and Europe, debt distress in emerging market economies, and a lustreless Chinese economy, the rest of the segments had no other real option but to follow the leading Capes on this downward spiral.
Reluctantly, US inflation eased slightly in July at last on the back of lower petrol prices. In particular, the Consumer Price Index for All Urban Consumers was unchanged in July on a seasonally adjusted basis after rising 1.3 percent in June, according to the US Bureau of Labor Statistics. Upon receiving the news, stock markets jumped, with the leading S&P 500 index increasing considerably and entering into positive territory for the month. In the opposite direction from the US inflation, albeit from a much lower basis, China’s consumer price index rose by 2.7 percent in July from a year earlier, up from 2.5 percent in June.
The prices of food, tobacco and alcohol increased by 4.7 percent year-on-year. Among foodstuff, the price of fresh fruit increased by 16.9 percent; the price of livestock meat increased by 8.4 percent, of which the price of pork increased by 20.2 percent. China's pig herd had been contracting in the past year as falling margins pushed some farmers to exit the market or reduce the number of their sows to curb heavy losses. Tight supplies and a recovery in demand pushed China's pork prices higher in July on an annual and monthly basis. Against this backdrop, China's state planner urged top hog breeders to ensure steady supplies. Additionally, Beijing agreed to waive some requirements from the phytosanitary agreement signed with Brazil to allow corn exports this year. The Ministry of Agriculture of Brazil stressed that China's private sector has already requested import licenses from the Chinese government. However, no deadline was set for the beginning of shipments. Mid-August, trading companies expected to export at least 1 million tonnes of corn this year to China, sources close to the negotiation say. This news came in a period when China’s soybean imports in July took a 9.1-percent dive from a year earlier and the main P6 Baltic index (ECSA FH) was struggling to find a floor.
Up until the end of August, China produced 608 million tonnes of steels, down 7.1 percent from the same period last year. At the same time, it imported 627 million tonnes of iron ore, down 3.4 percent year-on-year. On the flip side, China mined an additional 10.8 percent of its own iron ore to a total of 613 million tonnes. A similar story played out for coal. In the first seven months, coal imports were considerably lower by 18 percent to 138.5 million tonnes whereas local mining was up 11.5 percent to 2.56 billion tonnes. Soaring international coal prices, compounded by the war in Ukraine, created that substitution effect to the detriment of bulkers. Russian coal imports to China have been up 65 percent to 7.4 million tonnes, displacing longer hauled coal imports.
Having spent a good part of the current trading year competing with the splendid 2021 performance, Baltic Dry Index had a first-sixmonth average of 2279 points – very similar to the one of the previous year. However, July and August had a very different story to narrate. Whilst last year, spot market during these months was full of confidence, reporting strong gains week after week, it kept losing steam one year later, leading to an end-of-August closing of just 965 points. Indicative of the immense pressure is that the BDI was lingering in the end of August well below its average value for both the 2011-2015 and 2016-2020 trading periods. In sync, China's factory activity declined further in August as new Covid-19 infections, the worst heatwaves in decades and an embattled property sector weighed on production.

On the same wavelength, the S&P Global Eurozone Manufacturing PMI fell to 49.6 in August, down from 49.8 and further beneath the 50.0 mark that separates growth from contraction. Although only just below 50, this was the lowest reading since June 2020 and signalled a second successive deterioration in manufacturing operating conditions. The au Jibun Bank Japan Manufacturing PMI balanced at 51.5 in August, following a July reading of 52.1. While marking the 19th month of expansion in the sector, the latest figure was the lowest since September 2021, amid growing economic headwinds. In a similar vein, the S&P Global South Korea Manufacturing PMI dropped to 47.6 in August 2022 from 49.8 in July. Amid weaker global economic conditions, this was the second straight month of contraction in factory activity and the fastest contraction since July 2020. In reference to the world’s largest economy, the S&P Global US Manufacturing PMI pointed to the slowest growth in factory activity since July of 2020, balancing at 51.5. Output contracted for a second straight month as new orders fell for a third month in a row amid weak demand, due to increased inflation and economic uncertainty. With manufacturing activity being in contraction across the board and Capesizes being in the doldrums, BDI reported an August average of 1411 points, or the lowest of the last twenty months.
September started with the ECB increasing eurozone borrowing costs by 75 bps to their highest level since 2011. At the same time, European Union was facing a meteoric rise in energy prices. The European Commission has asked its members to consider five immediate moves including a plan to redistribute some energy producers’ windfall revenue to businesses and households, a price cap on Russian pipeline gas, and mandatory targets for reducing electricity use during peak hours, among other possible measures. In sharp contrast, metal prices had been under downward pressure.
In particular, iron ore prices dropped to their lowest level since March 2022, balancing at $97.19 per tonne as of 7th September. The decline in iron ore prices was driven by multiple market factors, including China’s zero Covid policy, global economic slowdown, and a numb downstream demand in the Chinese property sector. In tandem, LME copper moved south, with price of the metal being 29 percent below its record high of $10,845 hit in March. On the same wavelength, oil prices took a dive that week, as a renewed fear over recession and a strong US dollar weighed on the commodity. Brent crude price dropped in early September below the $90-mark for the first time since February.
Whilst an energy crisis in Europe was ante portas and metal prices were already feeling the effect of global economic slowdown, China’s export growth weakened in August and imports shrank. Exports rose 7.1 percent in August from a year earlier, marking the first slowdown since April. Rising interest rates, inflation and geopolitical tensions in unison had a negative bearing on outbound shipments. In reference to Chinese imports, the worst heatwaves in decades, a property crisis and sluggish consumption pushed the imported volumes materially lower. China's imports of crude oil, iron ore and soybeans all fell during the first eight months, as strict Covid-19 curbs and extreme heat disrupted domestic output. As far as drybulk commodities go, China’s imports of iron ore rose 5.5 percent month-on-month in August, even as operating rates at furnaces only slightly improved.
The world’s top iron ore consumer brought in 96.21 million tonnes of the steelmaking material, down slightly from the 97.46 million tonnes imported in August 2021. In the first eight months of 2022, total seaborne iron ore arrivals lay at 705.45 million tonnes, or down by 2.02 percent compared to the same period last year. China’s coal imports rose in August to 29.46 million tonnes, up from 23.52 million in July. From January to August though, China imported 167.98 million tonnes of coal, or down a significant 14.9 percent year-on-year. Whilst iron ore and coal imports moved higher in August, soybean imports plunged by 24.5 percent year-on-year. China purchased 7.17 million tonnes of soybeans in August - the lowest for the month of August since 2014. During the same period, Baltic Dry Index kept trending lower, touching one local minimum after the other. However, on the late side of the first trading week of September, iron ore rebounded amid China's intensified support for an ailing property market. In a similar vein, from August 29 to September 2, the average pork price tracked by the Ministry of Agriculture and Rural Affairs was 30.33 yuan (circa $4.39) per kg, up 6.9 percent week-on-week.
The price was 61.6 percent higher than a year ago. Against this backdrop, China’s state planner urged top hog breeders to ensure steady supplies, a factor to possibly support grain export activity from ECSA. Given the aforementioned, a sense of bottoming out in the spot market became apparent. In spite of a positive market reaction in mid-September, a helicopter view reveals the actual size of the vast downward correction in both the container and dry bulk markets.
Once such a fall is taking place, all eyes are on China and in particular on the property sector. Woes in China's property market worsened in August, with official data showing home prices, sales and investment all falling, as a mortgage boycott and developers' financial strains further hurt confidence in the sector. From January to August, the national real estate development investment was 9,080.9 billion yuan, a year-on-year decrease of 7.4 percent. The newly founded area of houses was 850.62 million square meters, down 37.2 percent. Among them, the newly started residential area was 624.14 million square meters, down 38.1 percent. The completed area of houses was 368.61 million square meters, down 21.1 percent. Among them, the completed residential area was 267.37 million square meters, down 20.8 percent. More significantly, prices extended their year-on-year contraction for the fourth month in August, with prices last month falling 1.3 percent, the fastest annual pace in seven years, and suggesting longer-term homebuyer aversion.

Conversely, the growth rate of power production was accelerated. In August, the power generation was 824.8 billion kwh, a year-on-year increase of 9.9 percent and an increase of 5.4 percentage points over the previous month. From January to August, the power generation balanced at 5.6 trillion kwh, a year-on-year increase of 2.5 percent. From the perspective of energy sources, in August, thermal power and wind power accelerated, the growth of solar power slowed down, the growth of hydropower decreased year-onyear, and the decrease of nuclear power narrowed. Among them, thermal power increased by 14.8 percent year-on-year, 9.5 percentage points faster than last month. Despite that, China's daily coal output in August slipped to a three-month low of 370.44 million tonnes as some mines in its biggest coal mining regions reduced operations due to heavy rainfall and Covid-19 curbs.
On the other hand, coal imports stood at 29.46 million tonnes in August, up 25.3 percent from the prior month and 5.03 percent from a year earlier. However, the outlook for the seaborne coal was not so rosy, with the seasonal temperature drop and a softer tone in industrial activity both having a negative bearing on the demand of the least love commodity. The dry bulk market spent most part of the thirty-eighth trading week trying to understand which narrative to follow. On the one hand, most of the major central banks reasserted their commitments to tame a galloping inflation, stressing that a painless way to achieve this goal might not be on the table anymore. On the other hand, hopes of more stimulus to shore up China’s Covid-hit economy added to the buoyant mood of late. With both sides having, in fact, a well-supported story to narrate, Baltic forward values enjoyed a bumpy ride, with assessments changing constantly direction. As one would rationally expect market sentiment followed closely this carnival ride, ebbing and flowing in tandem.
On the central bank front, the Federal Reserve announced it was raising its key rate by another 0.75 percentage points, lifting the target range to between 3 percent and 3.25 percent - the highest level in almost 15 years. The move came despite mounting concern that the cost of controlling inflation could be a harsh economic downturn. In sync, other central banks also unleashed a wave of rate hikes. Earlier in September, the Bank of Canada hiked its policy rate to 3.25 percent. Canada was the first among the world’s advanced economies in the current policy-tightening cycle to deliver a 100-basis-point rate hike. The Reserve Bank of New Zealand last month delivered its seventh straight hike to lift rates to 3 percent, the highest since September 2015. Being on the same page, the Bank of England hiked interest rates by 50 basis points in the third week of September, with money markets pricing in a peak in rates at circa 4.9 percent by June 2023. Earlier that month, the Reserve Bank of Australia increased their base rates by another 50 basis points, taking its key rate to a seven-year high of 2.35 percent. Putting an end to the negative rates in Europe, the Swiss National Bank raised its policy rate by 75 basis points from minus 0.25 percent to 0.5 percent, following ECB’s lead few weeks before. At the same time as rate rises seemed to be a necessity in order to slow down demand, ease upward pressures on prices and avoid long-term damage to the economy, an East-West divergence in central bank actions became apparent. Bank of Japan maintained its ultra-low interest rates, swimming against the current.
However, Japanese authorities intervened to shore up the weak yen, being under pressure lately. On the same wavelength, China cut a crucial lending rate in mid-August, in an effort to shore up growth as the world’s second-biggest economy was buffeted by repeated coronavirus lockdowns and a worsening property crisis. Additionally, a new batch of eight mega projects in Shanghai was launched in the third week of September with a combined investment approximating 1.8 trillion yuan (US $256.8 billion).

One year ago, the last trading week of September started with Hong Kong’s stock market plummeting, as an escalating liquidity crisis of the Chinese property developer Evergrande showed signs of spreading beyond the sector. The sell-off in Asia hit European stocks that morning and futures’ prices were suggesting markets in New York would open materially lower. Few hours later, the S&P 500 took a 2.9 percent dive, before closing with a daily drop of 1.7 percent and marking its worst day of trading since May 2021. In sync, commodity prices, including iron ore and copper, took a hit, as the potential collapse of one of China’s biggest property developers fuelled worries about potential declines in construction and demand for raw materials. With growing concerns for a Minsky Moment" in China's property sector, the CBOE volatility index – the "fear gauge" – was hitting its multi-month maxima.
Twelve months later, a sudden major collapse of asset values – as expected by a "Minsky Moment" scenario – might not had happened, yet still China's property sector didn’t seem to be on the right foot. Prices for new homes in 70 Chinese cities fell by a worsethan-expected 1.3 percent year-on-year in August, according to official figures, reflecting a turbulent 12 months in which China’s housing sector went from an unstoppable driver of prosperity to being the chief threat to the world’s growth locomotive. Additionally, nearly a third of all property loans were classed as bad debts – 29.1 percent, up from 24.3 percent at the end of last year.
Trying to tackle a deepening property crisis, Chinese local governments may relax the floor on mortgage rates for first-time home buyers in some cities in phases. Analysts stressed that the mortgage rate floor relaxation was quite positive for sentiment, but more stimulus measures were needed. Spot market seemed to be in accord with analysts, as the Baltic Dry Index was losing steam during the last trading week of the third quarter. The general feeling in the spot market was, for yet another week, that a temperate support kept the market afloat rather than the presence of an assertive force able to drive the market back to the recent 2022 highs.
For the first half of 2022, dry bulk market was echoing the fertile 2021 trading environment. However, it was around the end of May, when numerous bearish factors began kicking in, blurring the picture. Among them, a feeling of a softening world trade activity started building momentum. Aside from the bullish among us stargazing super-cycles and markets through the roof for the third quarter, consensus was focusing on the major shifts in monetary policies across the globe along with a recession aroma, probably having a negative bearing on the short-term prospects of the sector. In fact, the macroeconomic burden was hard on dry bulk’s knees during the third quarter, pushing Baltic indices materially lower. In particular, the leading BCI TCA had a Q3 average of $13,695 daily, or down by 67.7 percent year-on-year. In tandem, BPI TCA, BSI TCA and BHSI TCA reported quarterly averages of $17,172, $19,728 and $18,709 per day respectively, more than forty percent below the respective averages a year ago in all segments. The third quarter concluded with BCI TCA balancing at $16,214, BPI TCA at $18,742, BSI TCA at $18,292 and BHSI at $18,159 daily. All the aforementioned values were considerably lower than where they had started just three months ago.
