
Chart of the Week: VLCC MEG - China
The freight rates for the MEG (Middle East Gulf) to China have decreased in May

Data Source: The Signal Ocean Platform- Supply / Demand Ton Charts
https://go.signalocean.com/e/983831/-dynamic-market-prices-tankers/2nymrj/320259852?h=h4z-JkOpuQ4cUrF-0OfQzFHPdhbyrNEH_2qh4Rfh39k
https://go.signalocean.com/e/983831/tanker-reports-vesselSpeeds/2nymrm/320259852?h=h4z-JkOpuQ4cUrF-0OfQzFHPdhbyrNEH_2qh4Rfh39k
The sustained decline in Very Large Crude Carrier (VLCC) freight rates from the Middle East Gulf (MEG) to China continues, despite expectations of increased Chinese oil demand this year, as projected by the latest estimates from the International Energy Agency (IEA). The sustained decrease in rates throughout May reflects the prevailing market conditions and suggests a notable shift in the supply and demand dynamics in this particular trade route.The left chart above illustrates this downward trend, with freight rates (WS rates) currently at their lowest level since the start of the year. Consequently, this has led to a reduction in high seagoing ballast speeds, as depicted in the right chart above, compared to the earlier recorded levels earlier this year.
In the oil market, when examining the supply and demand fundamentals, there is a significant development on the horizon. According to the International Energy Agency (IEA), it is anticipated that demand will surpass supply starting this quarter, marking the first occurrence since early 2022. This projected shift towards a deficit is expected to deepen throughout the year, with the deficit estimated to reach nearly 2 million barrels per day by year-end. This indicates a potential tightening of the oil market and underscores the potential impact on prices and market dynamics.
For more information on this week's trends, see the analysis sections below:
Freight Market, Supply and Demand
SECTION 1/ FREIGHT - Market Rates (WS)
‘Dirty’ VLCC - Weaker | Suezmax - Aframax - Firmer

Sentiment surrounding VLCC crude oil freight rates continues to weaken for the third consecutive week, while the Suezmax Wafr-Cont route has shown noticeable signs of firmness.
VLCC AG-FE freight rates reached WS44, representing a modest increase of only 3 points compared to the previous week. However, these rates are significantly lower, nearly 24 points below the peak observed in week 16.
Suezmax freight rates from West Africa to continental Europe have witnessed a notable increase, reaching WS 122. This represents a substantial rise of 30 points compared to the rates recorded three weeks ago. Moreover, the trend indicates a growing sense of firmness in the market for the remainder of May.
Aframax Med freight rates have not only sustained the surprising rise witnessed in the previous days but have also climbed further to reach WS 190. This represents an impressive 40-point increase compared to three weeks ago. The overall trend for May indicates a notable firming in the Aframax Med market.
‘Product’ LR Weaker

LR2 AG freight rates have experienced a significant decline, dropping to approximately WS 120. This represents a substantial decrease of 40 points compared to rates observed two weeks ago. The market's momentum for May has weakened, indicating a downward trend in LR2 AG freight rates.
LR1 MEG -to-Japan freight rates have eased to WS 150, marking a notable decrease of 50 points compared to rates observed three weeks ago. This decline indicates a shift towards lower levels. The expected trend suggests that rates will likely continue at similar levels for the remainder of May.
Product’ Panamax - Firmer
Panamax Carib-to-USG rates have displayed a more positive outlook following a decrease observed in the previous week. Currently standing at WS 300, these rates have witnessed a significant increase of 60% compared to the previous week's low. This notable uptick indicates a firmer market sentiment and suggests a recovery in rates within this trade route.
‘
Clean’ MR2 - MR1 - Weaker

MR1 rates for shipments from Algeria to the Mediterranean decreased to WS145, which is 5 points lower compared to the previous week and nearly 50% lower than the rates in mid-April. Similarly, in the Baltic to Continent route, the MR1 rates experienced a more significant decline, dropping to approximately WS120, marking a 40% decrease compared to the levels observed in late April.
MR2 rates for shipments from the Continent to the US remained at the lower end, with WS125, suggesting a continuous downward trend throughout May, reflecting a decline of almost 20% from the levels seen in late April."
SECTION 2/ SUPPLY - (# vessels)
'Dirty' Supply Trend Lines for Key Load Areas
VLCC - Aframax - Decreasing | Suezmax - Increasing

In the third week of May, there was an upward trend observed in the supply of VLCC crude oil tankers, particularly in the Suezmax segment. However, there are indications of a downward correction following the escalation witnessed in the earlier days of the month.
VLCC Ras Tanura: The current vessel count stands at 62, which is 14 vessels lower than the annual average and almost 20 vessels lower than the peak observed in the second week of May.
Suezmax Wafr Bonny: The current vessel count is 56, reflecting a 25% increase from the low point observed in week 18. Moreover, there are indications of an upcoming upward trend in the remaining days of May.
Aframax Primorsk: The number of ships has dropped to 23, which is 6 vessels lower than the previous week and 11 vessels below the annual average. In general, there appears to be significant volatility around the annual average of 35, and this week's levels indicate a decrease that is expected to persist below the annual average in the coming days.
Aframax Med Novo: The number of vessels has been hovering around the annual average of 11, exhibiting a consistent trend over the past three weeks.
‘Clean’ Supply Trend Lines for Key Load Areas |LR2| Increasing

‘Clean’ Supply Trend Lines for Key Load Areas |MR1| Decreasing
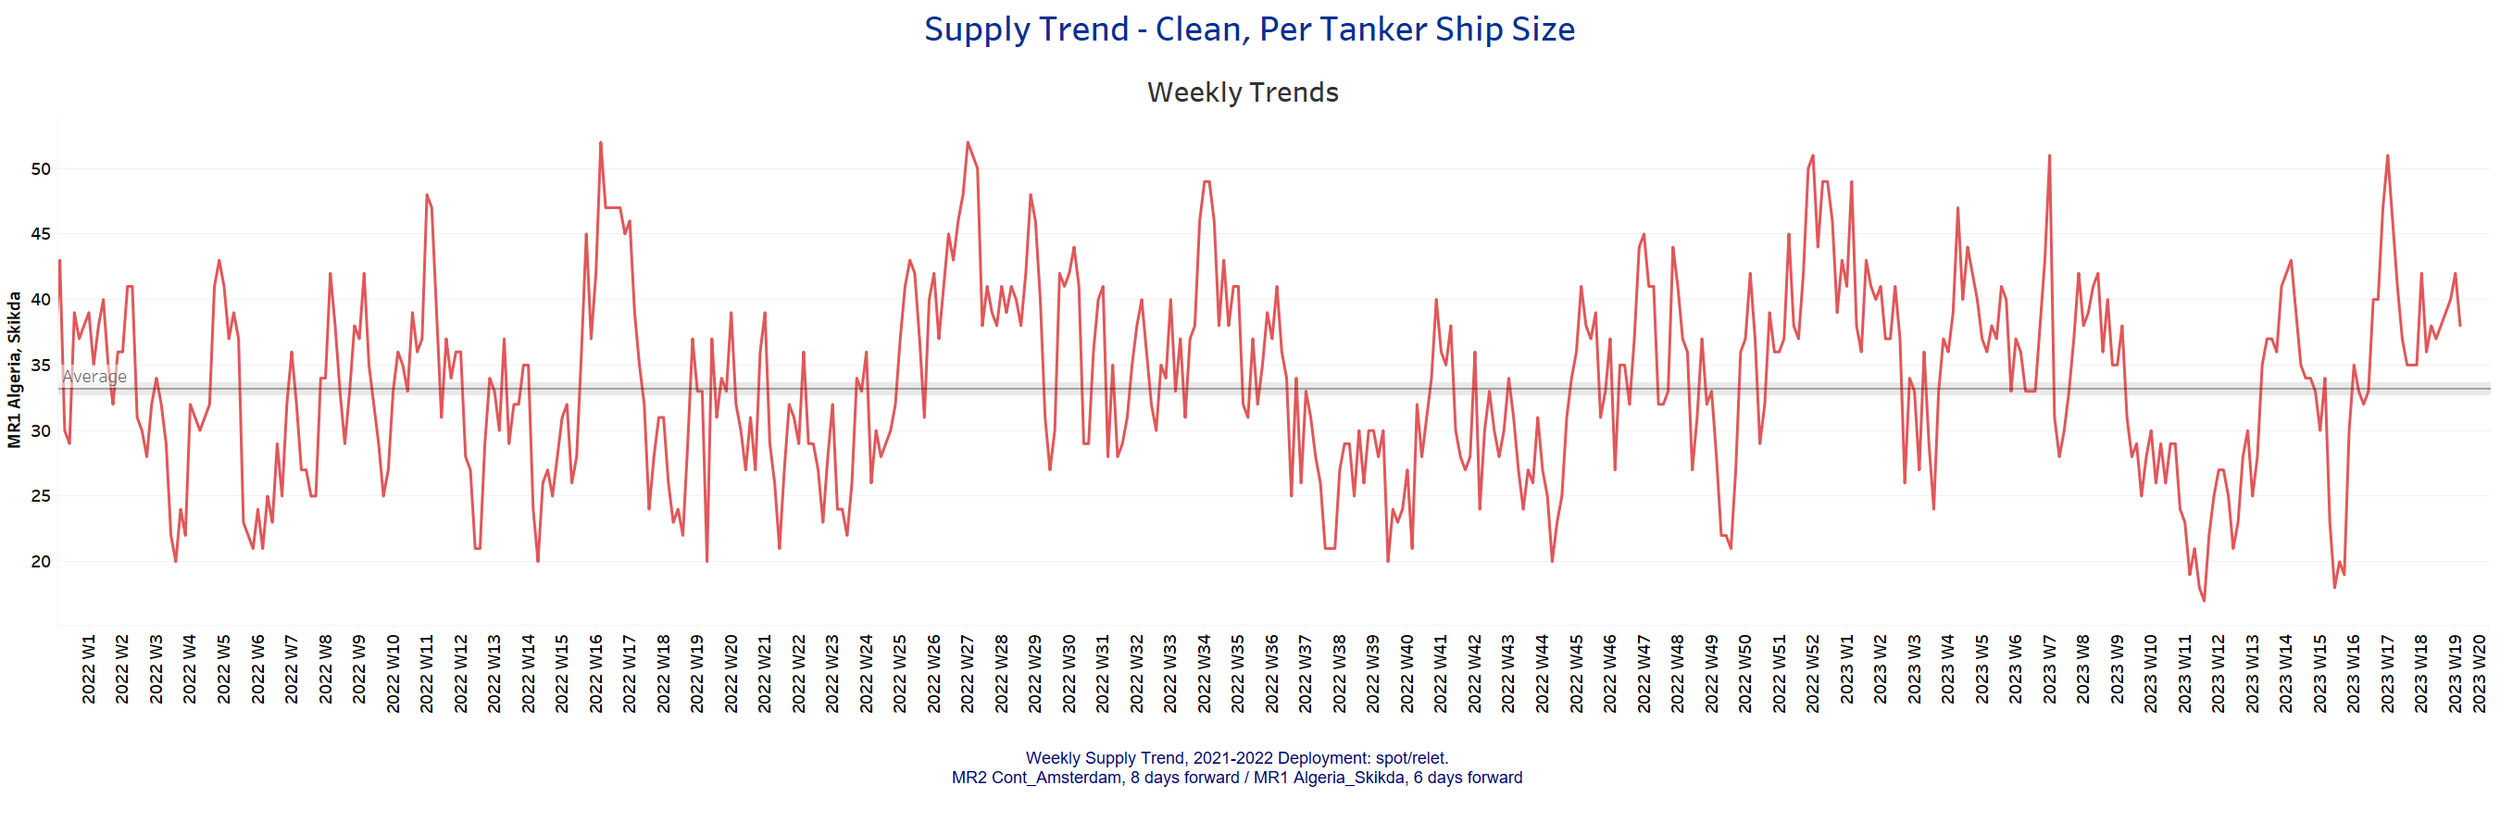
Clean LR2 AG Jubail: The number of vessels has been on an upward trend, surpassing the annual average of 14. However, it is currently 4 vessels lower than the peak observed in week 14.
Clean MR1 Algeria Skikda: The number of vessels has declined to 38, marking a 25% decrease compared to the count two weeks ago. Furthermore, there is a noticeable trend indicating a further decrease expected during the second half of May.
SECTION 3 - DEMAND - Ton Days
‘Dirty’ | VLCC - Decreasing | Suezmax - Aframax - Increasing

‘Clean’ | Panamax - MR - Decreasing

Dirty demand ton-days: The demand for VLCCs has not exhibited any signs of improvement, persistently declining throughout the month of May. Conversely, the Aframax segments have experienced an upswing, rebounding after a significant decline in week 18.
Clean demand ton-days / Panamax demand: The sharp downward correction observed three weeks ago remains unchanged in terms of magnitude. Furthermore, there are indications of a lingering weakness as we approach the end of the month.
Clean MR: The demand for both MR1 and MR2 vessel sizes is currently experiencing a negative momentum, with the most recent peak observed in late April. Presently, the demand has reached its lowest point since the collapse witnessed in week 11, indicating a significant decline in market activity for these vessel sizes.
Data Source: Signal Ocean Platform