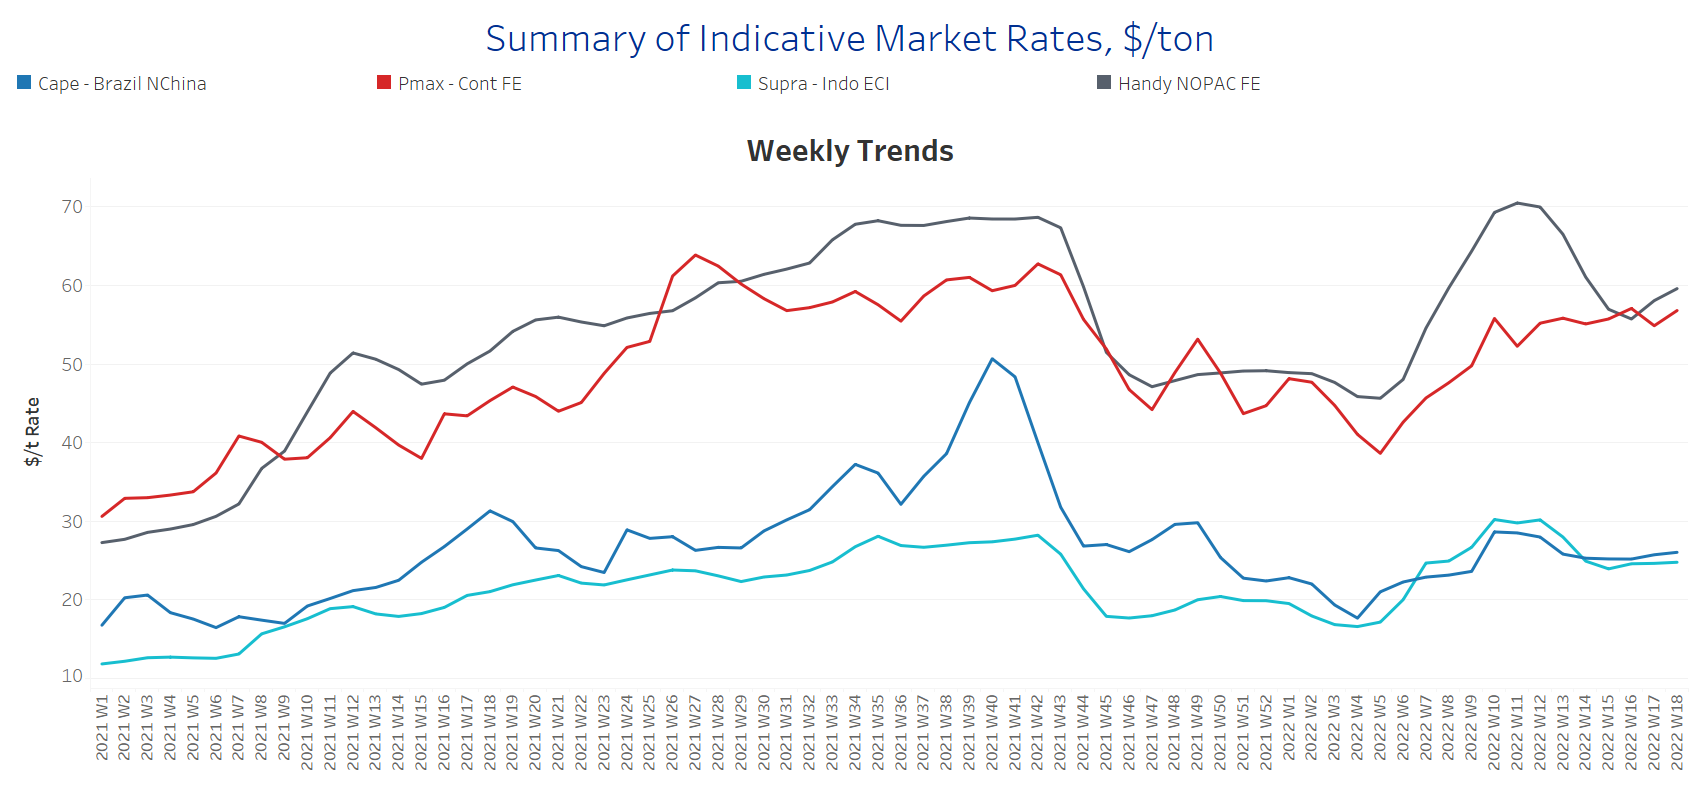
The first week of May signals a soft rebound in freight rates with Capesize demand in ton days posting signs of revival. In the iron ore market, prices for iron ore cargoes with a 63.5% iron ore content for delivery into Tianjin rebounded towards $14/t. The current level has not been seen for over a week and seems that the current euphoria stems from China's new policy measures to avert a slow economic growth for this year. President Xi Jinping emphasized that China would adopt a package of policies to help pandemic-hit industries, stepping up infrastructure construction and back healthy property market development.
In the meantime, Vale is planning to start up more iron ore capacity in Brazil during the second half of 2022 to meet strong demand from China that showed no signs of abating, despite tight restrictions to combat Covid-19 in the East Asian country, the Brazilian company said on Thursday, April 28.
In the coal segment, Newcastle coal futures, the benchmark for top consuming region Asia, moderated to around $325/t, posting a soft decrease from the five-week high of $331 reached in April. The increased prices are being supported by skyrocketing demand amid tight supplies of alternative energy products and sanctions on Russian coal. Alternative sources for strong purchases in the coming months appear to be coming from Australia and South Africa.
In the grain market, In the grain market, there is still a bottleneck in cargo flows from Ukraine. The director of the United Nations World Food Programme in Germany has warned that millions of tons of grain are stuck in Ukraine due to seaports being blocked by Russian military action. About 30m tons of corn and about 25m tons of wheat were harvested in Ukraine in 2020, according to the UN, with North African countries being dependent for their basic food provision on low-cost wheat from Ukraine.
In the last days, the surging of grain prices was eased following the proposal of a $500mil bill for the farming sector from the Biden administration. The last comes as an attempt to increase crop fields for the wheat producers. In addition, there are efforts for a stronger from India’s decision in entering the export market as higher wheat prices enabled farmers to divert new crops to private traders instead of state stockpilers. Lastly, Egypt, the world’s largest importer, is expected to purchase 1 million tons of wheat from India, including 240 thousand in April.
SECTION 1 - FREIGHT - Market Rates ($/t) - Firmer
‘The Big Picture’ - Capesize and Panamax Bulkers and Smaller Ship Sizes
The freight sentiment emerged firmer for the first days of May, however, the current signs of revival remain below the levels seen five weeks ago.
Capesize Brazil-to-North China freight rates held levels around $26/t, while the last peak was during Weeks 10 and 11 at levels of $29/t.
Panamax Continent-to-Far East freight increased to $57/t, with a trend of a further rebound in the next few days. The current evolution resembles the performance of Week 10 when rates accelerated till week 16.
Supramax Indo-to-ECI freight rates held almost a flat momentum with signs of soft increase during the last days. Rates are now around $25/t, $5/t less than Week 12.
Handysize NOPAC-to-Far East freight rates posted firmer signs of increase than last week at levels around $60/t, $4/t more than Week 16.
SECTION 2 - SUPPLY - Ballasters View
Number of Vessels - Increasing
Supply Trend Lines for Key Load Areas
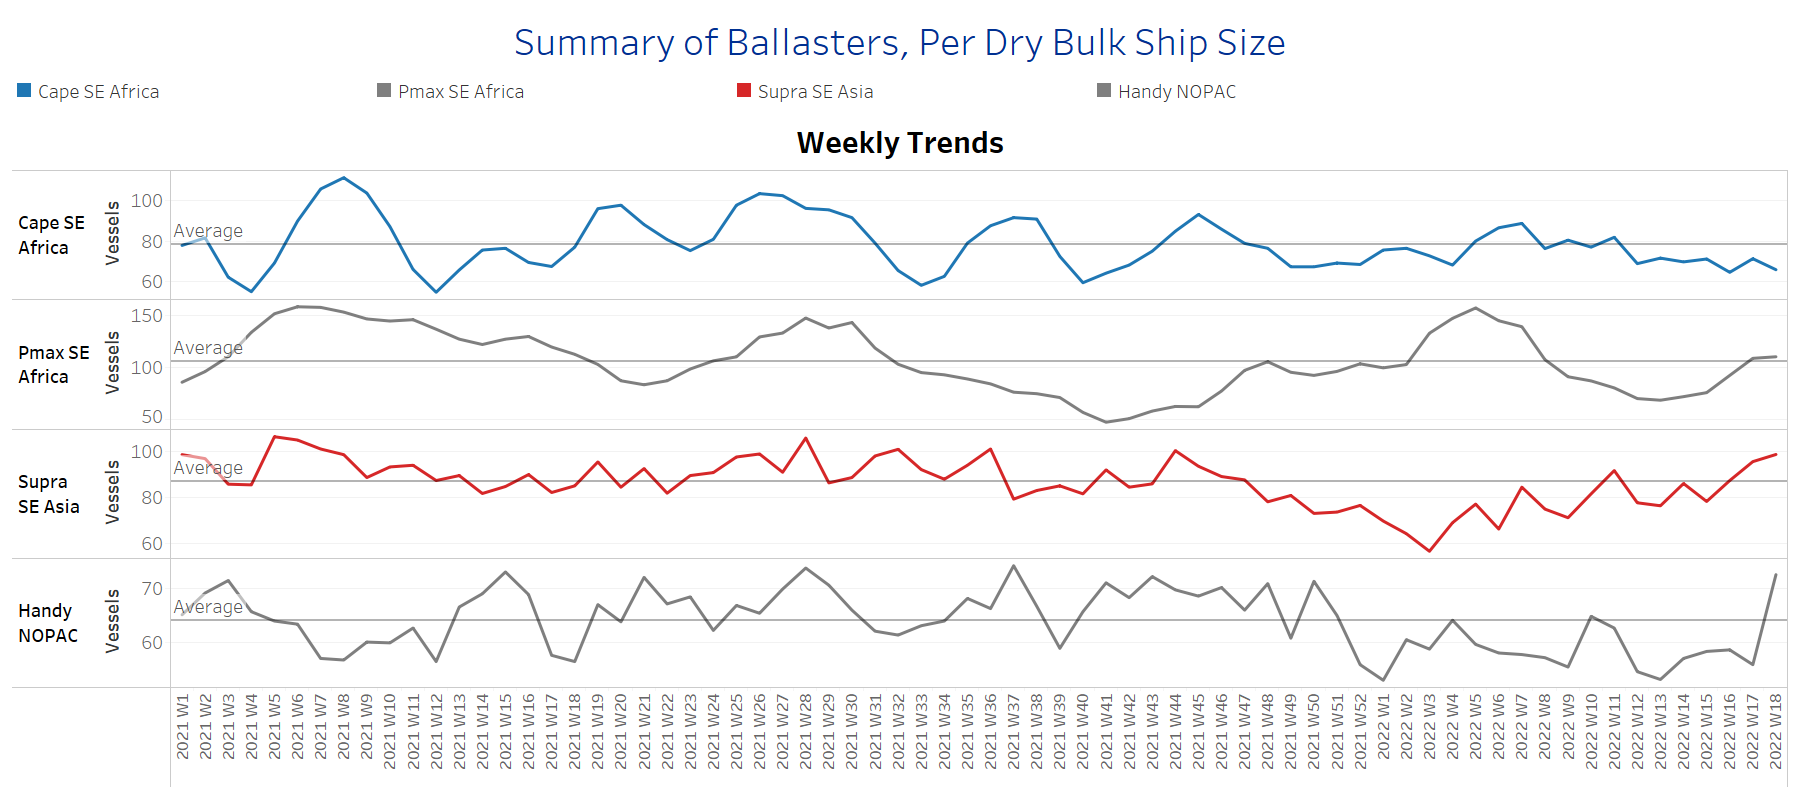
The number of ballasters signals a sharp increase in the Supramax and Handysize segments for the last two weeks, while in the Capesize, there are still levels below the one-year average.
Capesize SE Africa: The number of vessels sailing in ballast posted a slight drop to around 66 vessels, 6 vessels less than the previous week with a 20% decrease from the last peak of Week 11.
Panamax SE Africa: The number of vessels sailing in ballast surpassed this week the one-year average and increased to 111 vessels, a 60% increase from the low of Week 13.
Supramax SE Asia: The number of vessels sailing in ballast is now around 99 vessels, posting a 27% increase over the last two weeks.
Handysize NOPAC: The number of vessels recorded the highest increase to around 73 vessels, a 38% increase from the low of Week 13.
SECTION 3 - DEMAND - In Ton Days
Decreasing
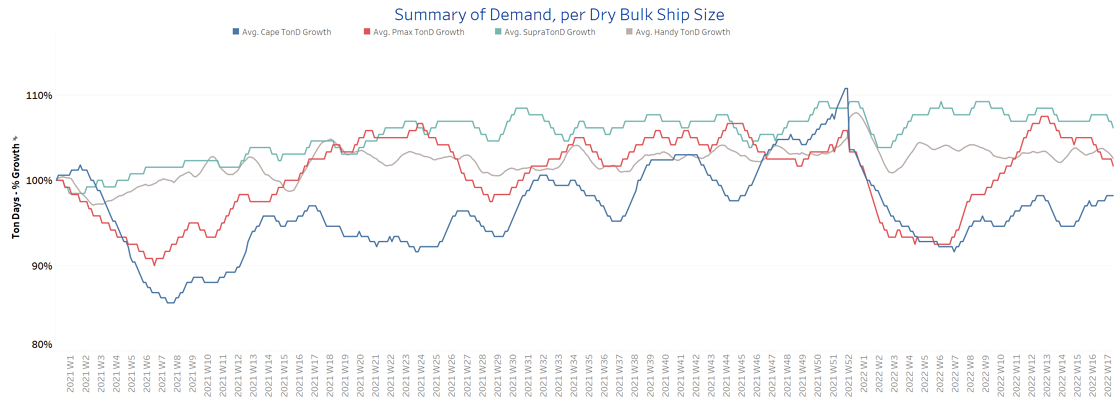
The overall trend of demand ton-days posted a further decrease since the last week, with signs of revival only seen in the Capesize segment since Week 14.
Capesize demand ton-days: There is a remarkable growth with levels nearing the days of the last peak during Week 12.
Panamax demand ton-days: There is still a strong downward revision since the last days of April, with levels of growth far below the peak of Week 12.
Supramax demand ton-days: The first days of May came with a soft decrease following a flat momentum for the last three consecutive weeks.
Handysize demand ton-days: The evolution of demand is now in a clear downward trend with the last spike during Week 14. It is interesting to note that for the current year, we haven't seen any remarkable weekly growth apart from the first 15 days of January.
SECTION 4 - CHINESE PORT CONGESTIONS -
Number of Vessels - Decreasing
Dry bulk ships congested at Chinese ports
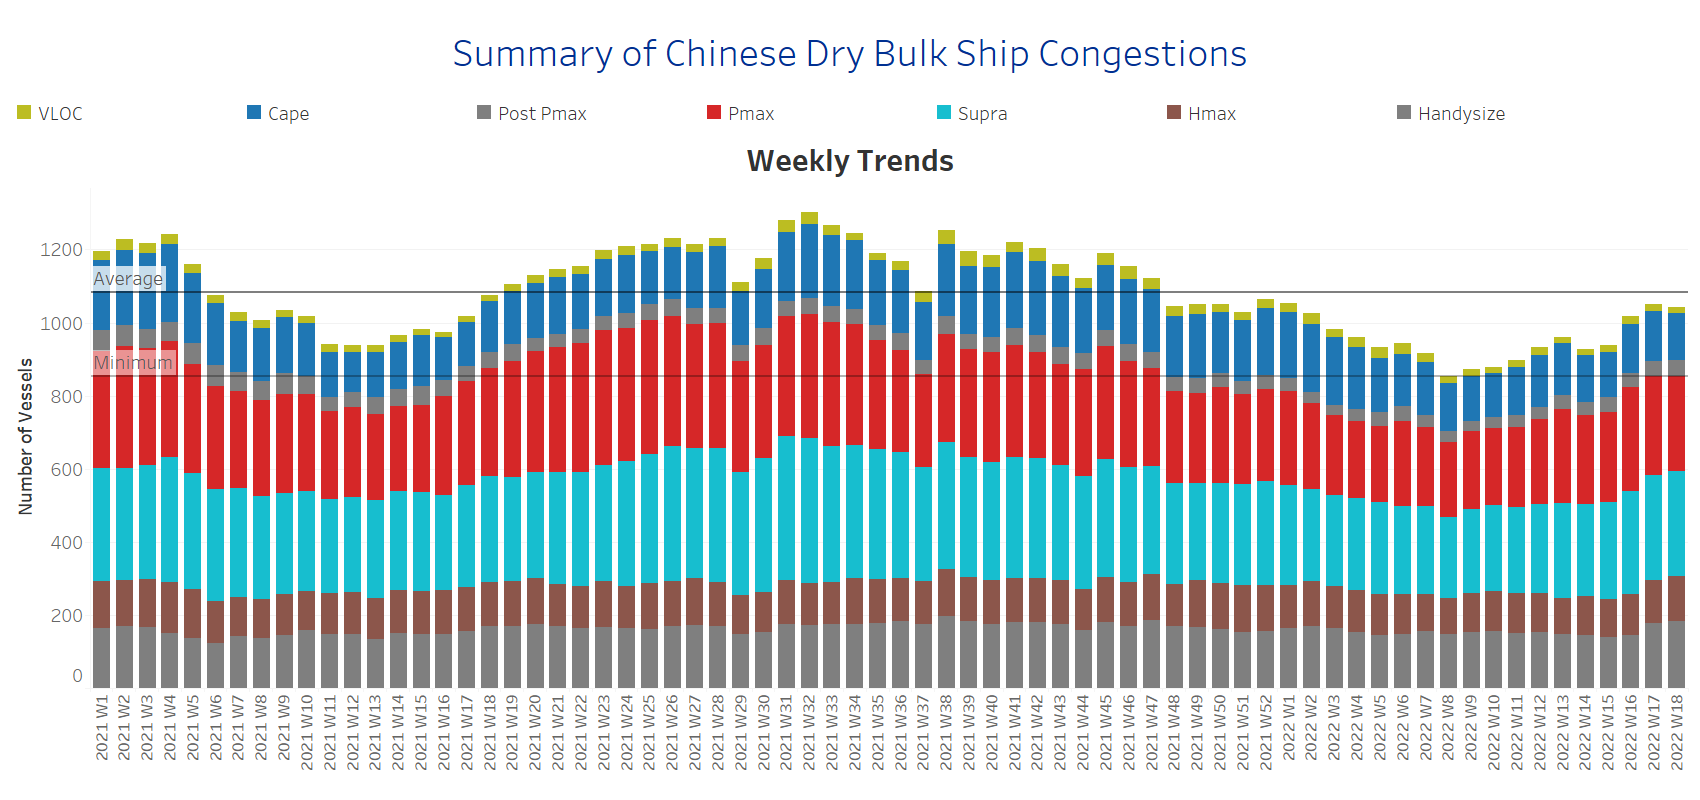
Dry bulk ships in congestion sustained increased levels but with a softer pace than last week’s spike. Overall, the Handysize, Panamax, and Supramax segments posted the highest levels during the last three weeks compared to the ending of Week 14.
Capesize: The number of ships in congestion posted a soft decrease to 130 vessels, 6 vessels less than the previous week.
Panamax: The number of ships dropped to 261, 9 vessels less than the previous week.
Supramax: The number of ships in congestion held last week’s levels at 287, a 20% increase since the ending of Week 14.
Handysize: The number of ships in congestion reached 183, a 26% increase since the ending of Week 14.
Data Source: Signal Ocean Platform


